1. Introduction
Bioaerosols, including bacteria, fungi, viruses, pollen, , animal and plant debris, can co�����ntribute to as much as 25% of the (; ). These bioaerosols play key roles in the Earth's system through their interactions with the atmosphere, which in turn influence the climate and affect public health. Specifically, microbes in the atmosphere enter the human body through the damaged skin, mucous membrane, digestive and ����, posing threats to human health and causing a variety of diseases, including infections, acute toxic effects, and even cancers (; ; ). These resulte�����d in increasing number of studies looking at characteristics of bioaerosols in the ����;over the past decade.
Many quantitative and qualitative studies have been done on culturable microbial , though culture-based����� bioaerosols only accounted for 0.1%–10% of the total microbial biomass (; ; ; ). This limitation in methods resulted in some important information about pathogenic bacteria and allergens being ������neglected since non-cultivable ������species are not detected. In contrast, molecular-based high-throughput technology has been shown to be an effective method to acquire another layer of information on bacterial diversity and community structures. The advent of this technology provides an opportunity to fully understand both culturable and nonculturable airborne microbes.
Bacterial cell size typically ranges from 0.5 to 2.0?μm, but bacterial cells could also form clumps or attach to other larger particles. As a result, bioaerosols generally ranges from 0.3 to 100?μm in diameter (). However, most studies on bacterial community structures in PM have only focused on finer particles (PM2.5), and information on PM2.5, PM10&nb�������������sp;and TSP remains little. It is then essential to investigate bacterial in the different sizes of .
Recently, serious air pollution events����� or hazy days have frequently occurred in China. High PM concentrations have been reported during these haze days (; ; ). Several studies further indicated that the concentrations of total airborne microbes (TABs) or viable bioaerosols on hazy and foggy days are significantly higher than non-hazy days (; ; ; ; ). Trends in PM also showed shifting peak of concentration to fine size range during haze days (). Some studies observed that bacterial communities were very similar between autumn and winter, but the dominant species differed. These studies however were just aimed at the bacterial community structures in single particulate size (; ; ). Little is still known about the differences in bacterial community and diversity in bioaerosols during the same samp������ling period between haze and non-haze days, especially in different sizes of particulate matter.
In addition, the such as , temperature, , wind speed and gas pollutants (O3, SO2, NO2, CO, etc.) had different degrees of influences on bacterial community and diversity (; ). found O3 and SO2������� to critically contribute to the variation in bacterial community in Shandong. reported that bacterial abundances in spring and autumn were higher than those in w������inter, which could be attributed to temperature differences between seasons. These show that, the bacterial community and diversity are strongly influenced by different environment conditions.
Most studies have also been focusing on the potential sources of airborne bacteria, but were not able to reach a uniform conclusion about the sources (; ; ). For example, and pointed that bioaerosols originated from any�������� environmental reservoir for microorganism, such as soil, leaves and animals. On the contrary, some other researchers found that dusts directly affected airborne bacterial communities by �������;transport (; ). These studies indicate that pinpointing bacterial sources is more complicated than previously thought. Many factors need to be accounted for, such as natural, and , weather conditions (rain, and haze pollution) and the typical surrounding environm�������e�������nt (farms, ranches, factory, etc.) (; ).
This study collected bioaerosol samples in Xi'an City, the largest semi-arid inland city in China. Samples collected were assayed by fluorescent microscopic method and used for high-throughput sequencing to generate bacterial community profiles. We aim to improve our understanding of bacteria diversity and community structures in various sizes of particulate matter (PM2.5, PM10 and TSP) on heavily hazy days. Furthermore, backward trajectory analysis was performed to reveal the possible sources of airborne microbes. Results of this study provide valuable data for hazard evaluation of bioaerosols on human health during the haze days, a������nd also improves our understanding of the potential sources of airborne bacteria.
2. Materials and methods
2.1. Sampling sites and samples collection
Airborne PM samples were collected in Chang'an University from October 2016 to January 2017 in Xi'�������an, China (34.23° N, 108.96° E, and 424?m above sea level). The sampling sites are situated between the 2nd and 3rd ring roads in Xi'�������an City. The sampling sites are 400?m away from the nearest major roads. Surrounding the sites are trees, greenbelts, residential and school buildings with no identified potential industrial . An air sampler (ZR-3930, Qingdao, China) was used to collect TSP、PM10 and PM2.5 (see Supplementary Fig. S1) onto 47?mm (diameter) sterilized ������������ membranes (Whatman, UK). All experimental vessels underwent high-temperature sterilization at 121?°C in a pressure steam sterilizer (LDZX-40BI, Shang'hai, China) for 20?min.
The environmental indices (PM2.5, PM10, SO2, NO2, CO, O3, and AQI) were obtained from a portable automatic meteoro������logical station (PH-1, Wuhan, China), which was installed near the sample sites. The air quality index (AQI) was generally applied to assess the air quality by China Met�����eorological Administration (CMA). It derived concentration of six major , namely PM2.5, PM10, SO2, NO2, CO and O3. AQI (PM2.5) was assigned to the level of PM2.5 in this study. When the value was >100, which is the limit for Chinese air quality standards Grade II, the environmental condition was categorized as hazy pollution. Based on these criteria, 7 hazy days and 5 non-hazy days were identified from the total of 12 sampling days included in this study. The environment�����al indices during this sampling period were presented in .
Table 1
| Sampling time | PM2.5 | PM10 | SO2 | CO | NO2 | O3_8h | Temperature | Wind speed | Visibility | Humidity | AQI | Air quality |
|---|
| 2016/10/27 | 18 | 28 | 8 | 1.4 | 34 | 38 | 11 | 13 | 5.4 | 100 | 43 | Non-haze |
|---|
| 2016/10/28 | 15 | 33 | 8 | 0.7 | 31 | 57 | 8 | 12 | 10 | 71 | 39 | Non-haze |
|---|
| 2016/10/31 | 43 | 100 | 14 | 1.2 | 47 | 65 | 11 | 8 | 6.8 | 93 | 75 | Non-haze |
|---|
| 2016/11/3 | 179 | 276 | 20 | 2.7 | 102 | 28 | 10 | 3 | 1.5 | 100 | 229 | Haze |
|---|
| 2016/11/4 | 169 | 248 | 21 | 2.6 | 99 | 30 | 12 | 3 | 1.7 | 100 | 219 | Haze |
|---|
| 2016/11/5 | 189 | 277 | 21 | 2.8 | 99 | 49 | 12 | 4 | 1.7 | 100 | 239 | Haze |
|---|
| 2016/12/20 | 437 | 506 | 51 | 4.2 | 86 | 13 | 4 | 4 | 1.1 | 87 | 458 | Haze |
|---|
| 2016/12/22 | 75 | 139 | 27 | 2.2 | 70 | 29 | 2 | 5 | 6.1 | 76 | 100 | Non-haze |
|---|
| 2016/12/27 | 45 | 92 | 20 | 1.5 | 51 | 62 | 0 | 10 | 7.6 | 74 | 71 | Non-haze |
|---|
| 2017/1/1 | 353 | 421 | 52 | 3.6 | 110 | 20 | 2 | 3 | 1.5 | 81 | 402 | Haze |
|---|
| 2017/1/3 | 373 | 445 | 35 | 4.2 | 122 | 29 | 2 | 5 | 6.1 | 80 | 416 | Haze |
|---|
| 2017/1/4 | 476 | 565 | 45 | 4.6 | 127 | 16 | 2 | 3 | 1.1 | 100 | 484 | Haze |
|---|
2.2. Fluorescent microscopic analysis of bioaerosols
The sampler was used with a flow rate of 16.7?L/min, and a duration of 15?min was set for each fluorescent sample of PM2.5, PM10 and TSP. After sampling, the polycarbonate membranes with bioaerosols were immediately transferred to 250?mL Erlenmeyer flasks containing 30?mL of phosphate buffer and 3?mL of Tween-80 solution, followed by shaking at 120?rad/min for 20?min. Next, the samples were filtered through a black Nuclepore Track-Etch membrane (Whatman, UK) and stained with 10?μg/mL DAPI (4′,6-diamidino-2-phenylindole) for 20?min in the dark. Then, DAPI-stained cells from 10 randomly selected ocular fields were counted using a fluorescent microscope (Shanghai Cewei Photoelectric Technology Co., Ltd, China) equipped with a UV light. The microscopic view of fluorescent stained samples is presented in Fig. S2. The standard deviation of the selected 10 microscopic views counted in every sample was calculated, averaging 2.98 from 76 samples. The concentrations of airborne microbes were calculated from the average number of DAPI-stained cells using the following formula ():
(1)C=Na×S×V2Sf×V1×V3
where C and Na represent the number of total microorganisms in each stage of the sampler (cells/m3) and the average number of DAPI-stained cells in each field (cells), respectively; Sand Sf denote the filtration area on the membrane and each field (mm2), respectively; V1, V2, V3 are the volume of the filtered sample (L), phosphate buffer (L) and collected air for the sample (m3), respectively.
2.3. DNA extraction, PCR amplification and Illumina sequencing
Every air sampler was sampled at a rate of 16.7?L/min over an hour sampling period. Soil and leaf sample�����s were also collected to evaluate potential sources of bacterial near the sampling site. After sampling, all samples were stored at ?80?°C until extraction of .
For each sample, genomic DNA was extracted using the OMEGA Soil DNA Kit following the manufacturer's instructions. Genomic DNA concentration and purity were measured using a Nano Drop ND-2000 (Nano Drop Technologies, Wilmington, DE) ���. The extracted DNA was then used as the template for PCR amplification. The primer set 338F (5′-ACTCCTACGGGAGGCAGCA-3′) and 806R (5′-GGACTACHVGGGTWTCTAAT-3′) were used to amplify the V3–V4 hypervariable regions of the bacterial 16S rRNA gene. These region provide accurate taxonomic information at the family level. The master mix for the PCR includes 5?μL 5× reaction buffer, 5?μL 5× GC buffer, 5?μL dNTPs (100?mM), 1?μL each of the primer(10?μM), 2?μL DNA Template and 8.75?μL ddH2O, for the total volume of 25?μL per reaction. The PCR protocol was as follows: initial denaturation step at 98?°C for 2?min, followed by the 30?cycles with denaturation������� at 98?°C for 15?s, at 55?°C for 30s, and elongation at 72?°C for 5?min. Then, the PCR products were purified using a PCR Purification Kit (Axygen Bio, USA) and pooled in equimolar concentrations of 10?ng·μl?1 before . �����Finally, paired-end sequencing of bacter�������ial amplicons were carried out in a Miseq Illumina platform at the Personal Biotechnology Co., Ltd (Shanghai, China).
2.4. Statistical analysis
Least-Significant Difference (LSD�����) one-way analysis of variance (AN�������OVA) was carried out to examine significant differences in the of bacteria between PM2.5, PM10and TSP. An independent sample t-test analysis was used to compare the mean concentrations of airborne microbes during haze and non-haze days. Spearman'������s rank correlation analysis was then used to examine correlations between ������and the airborne microorganisms. The analyses were performed in an IBM SPSS Statistics 22 for Windows, and a P-value <0.05 was c������onsidered statistically significant.
The R (x64 3.4.1) statistical computing environment was used for all community stat�����istics and visualizations. The relationship between environmental factors and bacterial relative abundance and was shown using a redu�����ndancy analysis (RDA).
Backward trajectory analysis was also carried out though the Hybrid Single-Particle Integrated Trajectory model (HYSPLIT-4,&�����n����bsp;) () to trace the source of .
3. Results and discussion
3.1. Concentrations of airborne microbes in PM2.5, PM10 and TSP.
The concentration variations of airborne microbes in PM2.5 (BioPM2.5), PM10 (BioPM10) and TSP (BioTSP) during the sampling period are shown in . Results showed that the mean concentrations of airborne microbes in different sized PM during non-haze days and haze days was lowest in BioPM2.5 (1.57?±?0.68?×?105?cells/m3 and 4.69?±?2.08?×?105?cells/m3), followed by BioPM10 (2.03?±?0.79?×?105?cells/m3 and 6.65?±?2.74?×?105?cells/m3), and highest in BioTSP (2.60?±?0.69?×?105?cells/m3 and 10.57?±?4.23?×?105?cells/m3). All concentrations were significantly higher on haze days (P?<?0.01). This was in agreement with who found that the concentration of airborne microbes in TSP on haze days (7.09?×?105?cells/m3) was higher than that on non-haze days (6.55?×?105?cells/m3) in Qingdao. Further, BioPM2.5 – associated microbes during non-haze day and haze-day accounted for 60.38% and 44.37% in BioTSP, respectively, while in BioPM10 concentrations reached as high as 78.08% and 62.91% in BioTSP for haze and non-haze days, respectively. found that viable BioPM2.5 in BioPM (>0.5?μm) in many cities located in Northwestern China (Gansu, Ningxia, and Shanxi) were lower, which might be attributed to more large-celled fungal present in the ����. Considering that the present sampling period was during the heating season in Xi'an, a large amount of dust was expected to be emitted, which in turn resulting in increased concentration of coarse particles. This was supported by a study of , which showed that dust ������was the dominant contributor to PM mass in Xi'��������an. Therefore, the levels of BioTSP increased with PM, and the proportions of BioPM2.5 and BioPM10 in BioTSP were lower than the other cities.

Fig. 1
shows the correlation����� coefficients between�������� and concentrations of BioPM2.5, BioPM10 and BioTSP. The concentration of airborne microbes was positively correlated with AQI, SO2, CO and NO2 (P?<?0.01). AQI increased with PM concentrations. Our previous studies showed that increasing quantity of PM provided more surfaces where more airborne microbes could adhere to (; ; ). Consequen�������tly, airborne micro�������bes increased with PM, both were positively correlated with AQI. Since , nitrate, and carbonate transformed from SO2, NO2, and CO could be utilized by viable microbes as resources, microbes were notably positively correlated wit����h these �����; as well (; ). In contrast, a significant negative relationship was observed between airborne microbes and wind speed, visibility or O3 (P?<?0.01), which were consistent with many previous studies (; ; ; ; ). Wind drives formation and spread of bioaerosols. Biological particles enter the atmosphere to form bioaerosols when the critical wind velocity exceeds 1–3?m/s (). However, wind speed was negatively correlated micr�����obial aerosols, because of the dilution effect of may lead to a reduction in bioaerosol concentration when the winds are too strong. It is generally inferred that O3, due to its strong bactericidal effect, could cause death or inactivation of microorganism. Hence, O3 showed significant negative correlation with airborne microbes. Visibility was also negat������ively correlated with microbial concentration since haze pollution decreases visibility.
Table 2
| AQI | SO2 | CO | NO2 | O3/8?h | Temperature | Wind speed | Visibility | Humidity |
|---|
| BioPM2.5 | 0.797 | 0.640 | 0.785 | 0.785 | ?0.651 | ?0.146 | ?0.750 | ?0.592 | 0.334 |
|---|
| BioPM10 | 0.790 | 0.598 | 0.781 | 0.781 | ?0.666 | ?0.039 | ?0.814 | ?0.683 | 0.493 |
|---|
| BioTSP | 0.797 | 0.731 | 0.802 | 0.802 | ?0.646 | ?0.104 | ?0.800 | ?0.634 | 0.297 |
|---|
3.2. Bacterial diversity in PM2.5, PM10 and TSP
The number of observed OTUs and diversity (mean?±?standard deviation) of atmospheric bacterial communities in PM2.5, PM10 and TSP are summarized in . Following quality filtering, the average number of high quality reads in PM2.5, PM10 and TSP were 28,344, 30,578 and 36,737, respectively. Community richness indices (Chao1 and ACE) in TSP (478.71 and 555.32) were higher than those in PM10 (378.25 and 430.79) and PM2.5 (304.67 and 348.24). Furthermore, the highest Shannon and Simpson indices, which are commu������nity , were observed in TSP (4.79 and 0.90), followed by PM10 (3.64 and 0.75) and PM2.5 (2.89 and 0.65). Moreover, sequence clustering showed that the number of OTUs both in phylum and genus levels in TSP was significantly higher than that of PM10 and PM2.5. These indicate that the abundance and diversity of bacterial commun����ity in different particle sizes were different. Coarser PMs would also be expected to ������have higher bacterial abundance and diversity.
Table 3
| Treatment | Richness | Diversity | OTUs |
|---|
| Chao1 | ACE | Simpson | Shannon | Phylum | Genus |
|---|
| PM2.5 | 304.67?±?115.77 | 348.24?±?117.18 | 0.65?±?0.10 | 2.89?±?0.52 | 411?±?114 | 222?±?41 |
|---|
| PM10 | 378.2?±?115.81 | 430.79?±?114.72 | 0.75?±?0.10 | 3.64?±?0.63 | 509?±?114 | 277?±?28 |
|---|
| TSP | 478.71?±?108.35 | 555.32?±?119.06 | 0.90?±?0.02 | 4.79?±?0.43 | 569?±?235 | 328?±?74 |
|---|
OTUs:������� operational taxonomic units (97% similarity)��������.
Apparently, aerosol size fraction influenced the diversity and composition of bacterial community. found that the level of bacterial diversity in coarse size fraction (PM10–2.5) was roughly 80% higher than those observed in the fine size fraction (PM2.5). reported that most bacteria attached to PM derived from the surrounding environment were typically more diverse than free-living planktonic bacteria. Most bacteria are generally attached to coarse particulates, which has higher sheltered surface area, allowing the bacteria to be protected from UV exposure, in addition to becoming carbon and energy sources. These make coarse particulates more favorable for bacteria to survive and propagate. On the contrary, owing to the small surface ar�������ea of fine particles, it is difficult for microorganism to �������attach. Moreover, as carriers of , fine particles adsorb more chemical components which may be toxic for microorganism to survive ().
3.3. Bacterial community structures in PM2.5, PM10 and TSP samples
shows the bacterial community structures in PM2.5, PM10 and TSP at the phylum (A) and genus (B) levels. At the phylum level (A), the dominant bacterial communities in PM2.5, PM10 and TSP were Firmicutes and Proteobacteria. Firmicutes accounted for 26.33%, 36.32% and 47.44%, respectively in the different particles, while it was slighlt higher for Proteobacteria at 58.94%, 55.24%, 40.81%, respectively. Interestingly, Firmicutes were highest in TSP. also reported that the Firmicutes could exist in the atmosphere preferentially as bacterial aggregates associated to larger PM. In contrast, Proteobacteria abundance����� decreased with increasing p������article size.

Fig. 2
At the genus level (B), , and Lactococcus were the top three genuses in the present air samples, accounting for 8.47–22.29%, 9.86–19.10% and 7.32–16.92% of the total high-quality sequences, repectively. However, the dominant genus varied with different size fractions. For example, in both PM2.5 and PM10, the most abundant were Pseudomonas, accounting for 22.2����9% an��������d 17.65%, repectively, while it was Bacillus in TSP (19.10%).
shows the bacterial community structures in different cities at the phylum level. It can be seen that the dominant bacterial phylum were also Firmicutes and Proteobacteria in most cities. However, compared to our re�����sults, previously reported of Actinobacteria were higher in Beijing, Milan and New York (; ; ; ; ; ). collected air samples from 40 cities in China and reported that five most abundant bacterial genera among the samples, were Bacillus (63.67%), Methylobacterium (3.61%), Lacococcus (3.42%), Massilia (2.60%) and Sphingomonas (2.46%). Their relative abundances were not only different from the present results obtained in Xi'an, but also different from data detected in other sampling sites. For example, the dominant genera in Ji'nan were Lactococcus (43.4%), Bacillus (28.4%) and Pseudomonas (7.6%) (). In contrast, the three most abundant genera in Beijing were Pseudomonas (53.38%), Lactococcus (16.09%) and Leuconostoc �������;(4.29%) (). These differences could be mainly due to the �����different sources in different sampling sites and seasons. More details about the reasons will be discussed below.

Fig. 3
3.4. Microbial pathogens in the different samples on haze days
The 15 most abundant bacterial genus in PM of different sizes on both haze and non-haze days are shown in . For the airborne bacteria, dominant genera for both haze and non-haze conditions were similar. Also, the relative abundances of the dominant genera in PM2.5, PM10 and TSP did not show significant differences on haze and non-haze samples (P?>?0.05). This suggests that there was no significant correlation between bacterial communities and haze pollution. Little information is available about airborne bacterial communities in PM2.5, PM10 and TSP during haze and non-haze days. We speculated that the relative abundances of some genera may have been influenced by the characteristics of the sources of bioaerosols. Similarly, ����observed bioaerosols, mainly coming from the surrounding environment, usually remained stable in a short time span unless affected by high-speed wind and precipitation. In Xi'an, since the in samples from autumn and winter were similar, we could hypothesize that the bioaerosols for these two seasons has similar sources. suggested that the high concentr����ation of toxic and in PM during haze days had adverse effects on the concentration of bioaerosols. However, we did not find that toxic and hazardous substances in PM had obv������ious influence on bacterial communities. also found that there were no pronounced differences in abundances of major bacterial genera between haze and sunny days in Beijing. Meanwhile, reported that air pollutants made little contribution to the airborne bacterial community. This was different from , who observed that atmospheric pollutants explained most of the variation (31.90%) in community structure of PM, and thus, PM was identified as the main factors shaping the bacterial communities. further reported that the impact of environmental factors on bacterial communities differed with seasons. Hence, the relationship between haze pollution and bacterial communities may not be same among regions and seasons. The relationship between environmental facto�����rs and bacterial communities will be discussed below.

Fig. 4
Several potentia����l at the genus level were identifi�������ed in this study, such as Pseudomonas, Acinetobacter, , , Neisseria, , Staphylococcus, Mycobacterium, Corynebacterium, and Micrococcus. These microbial genera are known to be harmful and could cause human diseases, although their relative abundances in the sample were not high. Acinetobacter is a conditional pathogenic���� bacteria, which can cause infection in different parts of the human body, such as lung the leading to etc. (). Sepsis caused by Acinetobacter is also a major nosocomial infection (). As an opportunistic human pathogen, Pseudomonas aeruginosa can infect in any part of the body and tissues, often in burns or trauma sites (). Serratia plymuthica, S.liquefaciens, S.rubidaesaand Neisseria meningitides could also through infection (). Corynebacteriumdiphtheriae is the pathogen �����responsible for diphtheria and cutaneous infection ().
summarized the relative abundance of the potential pathogenic bacteria on the haze and non-haze days. Results showed that the relative abundance of Proteobacteria and Neisseria (P?<?0.05) appeared to increase during haze days while others decreased. Despite this, it is interesting to note that we still did not find any significant correlations between air pollution and certain bacterial pathogens. No evidence was established linking haze pollution with increased abundance of bacterial pathogens. once reported that sequences related to several respiratory microbial allergens and pathogens, like Streptococcus pneumoniae, increased with PM concentration, but was not true for all pathogens. Many other studies suggested that the potential health risk during the haze days was related to the microorganisms in the aerosols (; ). This suggests that toxicity may be mainly attributed to the abiotic hazards, like toxic and hazardous chemical substances in PM instead of the pathogenic species. Another aspect that has not been explored in this study is the possible presence of some fungal pathogens and viruses, which could still be harmful to the human body. For example, some of fungal pathogens were detected in the PM from Urumqi (). found that the winter PM2.5 samples also harbored fungal pathogens, which were higher than the other seasons. fumigatus specifically, is a known major allerg������en and opportunistic pathogen, which appear to increase with PM pollution level. Human adenovirus, a dsDNA virus which can cause upper and low������er infections in children, was also found abundant in a severe event in Beijing (). However, little information is available for fungal pathogens and viruses present during haze and non-haze days. Abundance of pathogenic bacteria in the air also significantly varied among regions. For example, five pathogenic bacteria in Beijing were detected, including Streptococcus (0.47%), Prevotella (0.10%), Rickettsia (0.01%), Erysipelothrix (0.01%) and Enterobacter (0.001%) (). Some human pathogens were found in Hong Kong including Legionella, Pseudomonas, Shigella, , Staphylococcus, Streptococcus(), and in Hubei Province, Aeromonas, Coxie, Enterobacter, , Shigella were observed (). Not only the relative abundances but also the genera of the dominant pathogenic bacteria were different from the p������resent results. These differences could have resulted in varying epidemic associated with airborne microbes in different regions.
Table 4
| Phylum | Genus | Non-haze days | Haze days |
|---|
| Proteobacteria | Pseudomonas | 18.838% | 25.594% |
|---|
| Acinetobacter | 0.416% | 0.387% |
| Serratia | 0.149% | 0.016% |
| Neisseria | 0.007% | 0.019% |
| Firmicutes | streptococcus | 1.483% | 0.459% |
|---|
| Clostridium | 0.280% | 0.109% |
| Staphylococcus | 0.059% | 0.042% |
| Actinobacteria | Mycobacterium | 0.132% | 0.027% |
|---|
| Corynebacterium | 0.105% | 0.052% |
| Micrococcus | 0.025% | 0.016% |
3.5. Relationship between airborne bacteria community and environmental factors
Assessing the effects of environmental factors on bacteria is necessary since they influence bacterial survival, growth and diffusion (; ). The redundancy analysis (RDA) biplot (shown in ) showed that certain environmental factors were distinctly correlated to different samples. Interestingly, only a total of 56.37% of the variance was explained by all the environmental variables combined. The first axis explained 39.5% of the variation of genus-environment relationship, and temperature (TEM), wind speed (WS) and SO2 were most relevant with the first axis. The second axis accounted for 6.5%, where humidity (RH) seemed to be the most relevant. Meanwhile, it is evident that the most important drivers of microbial community structure were TEM, O3 and NO2, which accounted for 70.06%, 11.45% and 9.14% of the variation, respectively. The order of the degree influence of these factors was as follows: TEM?>?O3?>?NO2?>?SO2?>?WS?>?CO?>?PM10?>?VIS (visibility)?>?PM2.5?>?RH. This was consistent with those reported by , where temper�����ature was identified as a key factor in the structuring of aquatic bacterial communities. Increased temperature would promote bacterial growth, and speed up convective , enhancing bacterial dispersal in the atmosphere (). also found that two bacterial taxa were correlated with shifts in temperature over time. showed that have stronger germicidal effectivity against gram-negative and gram-positive species than t����he . also found that O3 was negatively correlated with bacterial aerosols, because the toxicity of O3 inhibits the growth of outdoor air bacteria. suggested �������that sulfate, and organic matter were among the most nutrient sources, and altogether their relative abundance in PM2.5 and PM10 samples were 80% and 71% (w/w), respectively. (NOx) and (SOx) can be converted into secondary pollutants under appro������priate (). Although it is known that airborne bacterial concentrations could be influenced by heavy particle matter pollution, especially during t�����he haze days, our present results suggest that PM had little effect on airborne bacterial communities than the other environmental factors. This also means that PM pollution had little impact on bacterial pathogens. The survival and growth of some bacterial pathogens are strongly influenced by meteorological factors. Although the relati������onship between airborne bacterial community and environmental factors were observed, the underlying mechanisms of these interactions remain unclear.
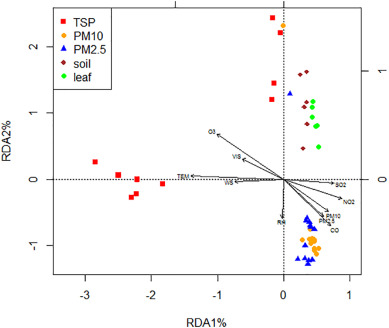
Fig. 5
3.6. Potential sources of airborne bacteria
Previous studies indicated that majority of the categorized bacteria in the atmosphere were from terrestrial sources. For example, Pseudomonas, Sphingomonadales and Rhizobiales, which were identified in air samples, were known to be plant-associated bacteria (), while Acinetobacter and Serratia generally exist����ed in water and soil (; ).
Most of the studies classified bacterial sequences and determined their potential sources by aligning against reference sequences in the GreenGenes 16S rRNA gene database (). However, studies determining bacteria presence in the atmosphere from local environment or atmospheric transfer are still lacking. Here, the bacterial samples from diff�������erent media, including and leaf surfaces near the sampling sites, were compared to explore the potential sources of airborne bacteria, as also shown in . Results indicated that the difference in airborne bacterial communities between PM10 and PM2.5 was very minor, but there were significant differences between TSP and PM2.5 as well as between TSP and PM10. Bacterial communities from soils and leaf surfaces were not significantly similar to airborne bacterial communities as they did not cluster together (see ), suggesting that the sources of airborne microbe����s in this study were not the local environment. It could have ������come from the different parts of the city or other regions by long distance airflow transport. The aerosols containing microorganisms can survive from their sources (). For example, reported that at Mt. Tai were more related��������� to those found in the from Yell������ow Sea (2.1%). It was also observed that Asian dusts could directly affect the airborne bacterial communities by air mass transport pathways (). Moreover, long-range transport of dust in the atmosphere is an efficient process for the dispersal of viable and non-viable bacteria in local, regional and even global scales (). ������� demonstrated that the air mass arriving at Xi'an on hazy days came from two main pathways: the southwest and southeast directions, instead of the Guanzhong Plain. shows the results of a 72-hour backward trajectory on 5th November (haze day) and 28th October (non-haze day). In this study, back trajectories during sampling period indicated that the air mass came from northwest direction during non-haze days (Fig. S3a). During the haze days, air mass mainly came from the southwest (Fig. S3b). These results supported our hypothesis that most of the airborne bacteria in Xi'an may come from the different parts of the city or other regions by long distance airflow transport.

Fig. 6
4. Conclusions
The present study showed that the airborne bacterial communities in PM2.5, PM10 and TSP were very similar. Differences in the of airborne bacteria in the different PM was associated with their sizes, such that coarser particles had more surface area for attachments while smooth surfaces lessened efficiency of adhesion. Haze pollution had no significant effects on bacterial community structures, and not����� all potential increased during increased haze pollution. Another important finding was that temperature, O3 and NO2 ��������had major influences on the bacterial community structures, while other , like PM, had little effect on bacterial community. Furthermore, the potential sources of bacteria in Xi'�������an may not come from the local environment, but rather from the different parts of the city or other regions by long distance airflow transport.
The present study only focuses on bacterial diversity and community in PM of different sizes. Although bacteria accounted to about 80% of atmospheric microorganisms, fungi and viruses could also cause some adverse effects on human health. Therefore, future studies need to consider the distribution characteristics of the fungi and viruses in the atmosphere under various environment conditions. Furthermore, bioaerosol samples at different sampling sites around Xi'an City should also be collected and assayed and compared their similarities to deeply understand and track sources of airborne microorganisms. This present work has shown that several gaseous and particulate pollutants were correlated with microbial concentrations and community structures, but the underlying mechanisms of their interactions remain unclear. Thus, in addition to fie������ld monitoring, it is essential that a laboratory chamber bioaerosol study should be carried out to determine how a single environmental factor affects bioaerosols. Also, culture-based and high-throughput methods sh�������ould be combined to obtain more comprehensive understanding about atmospheric microorganisms.